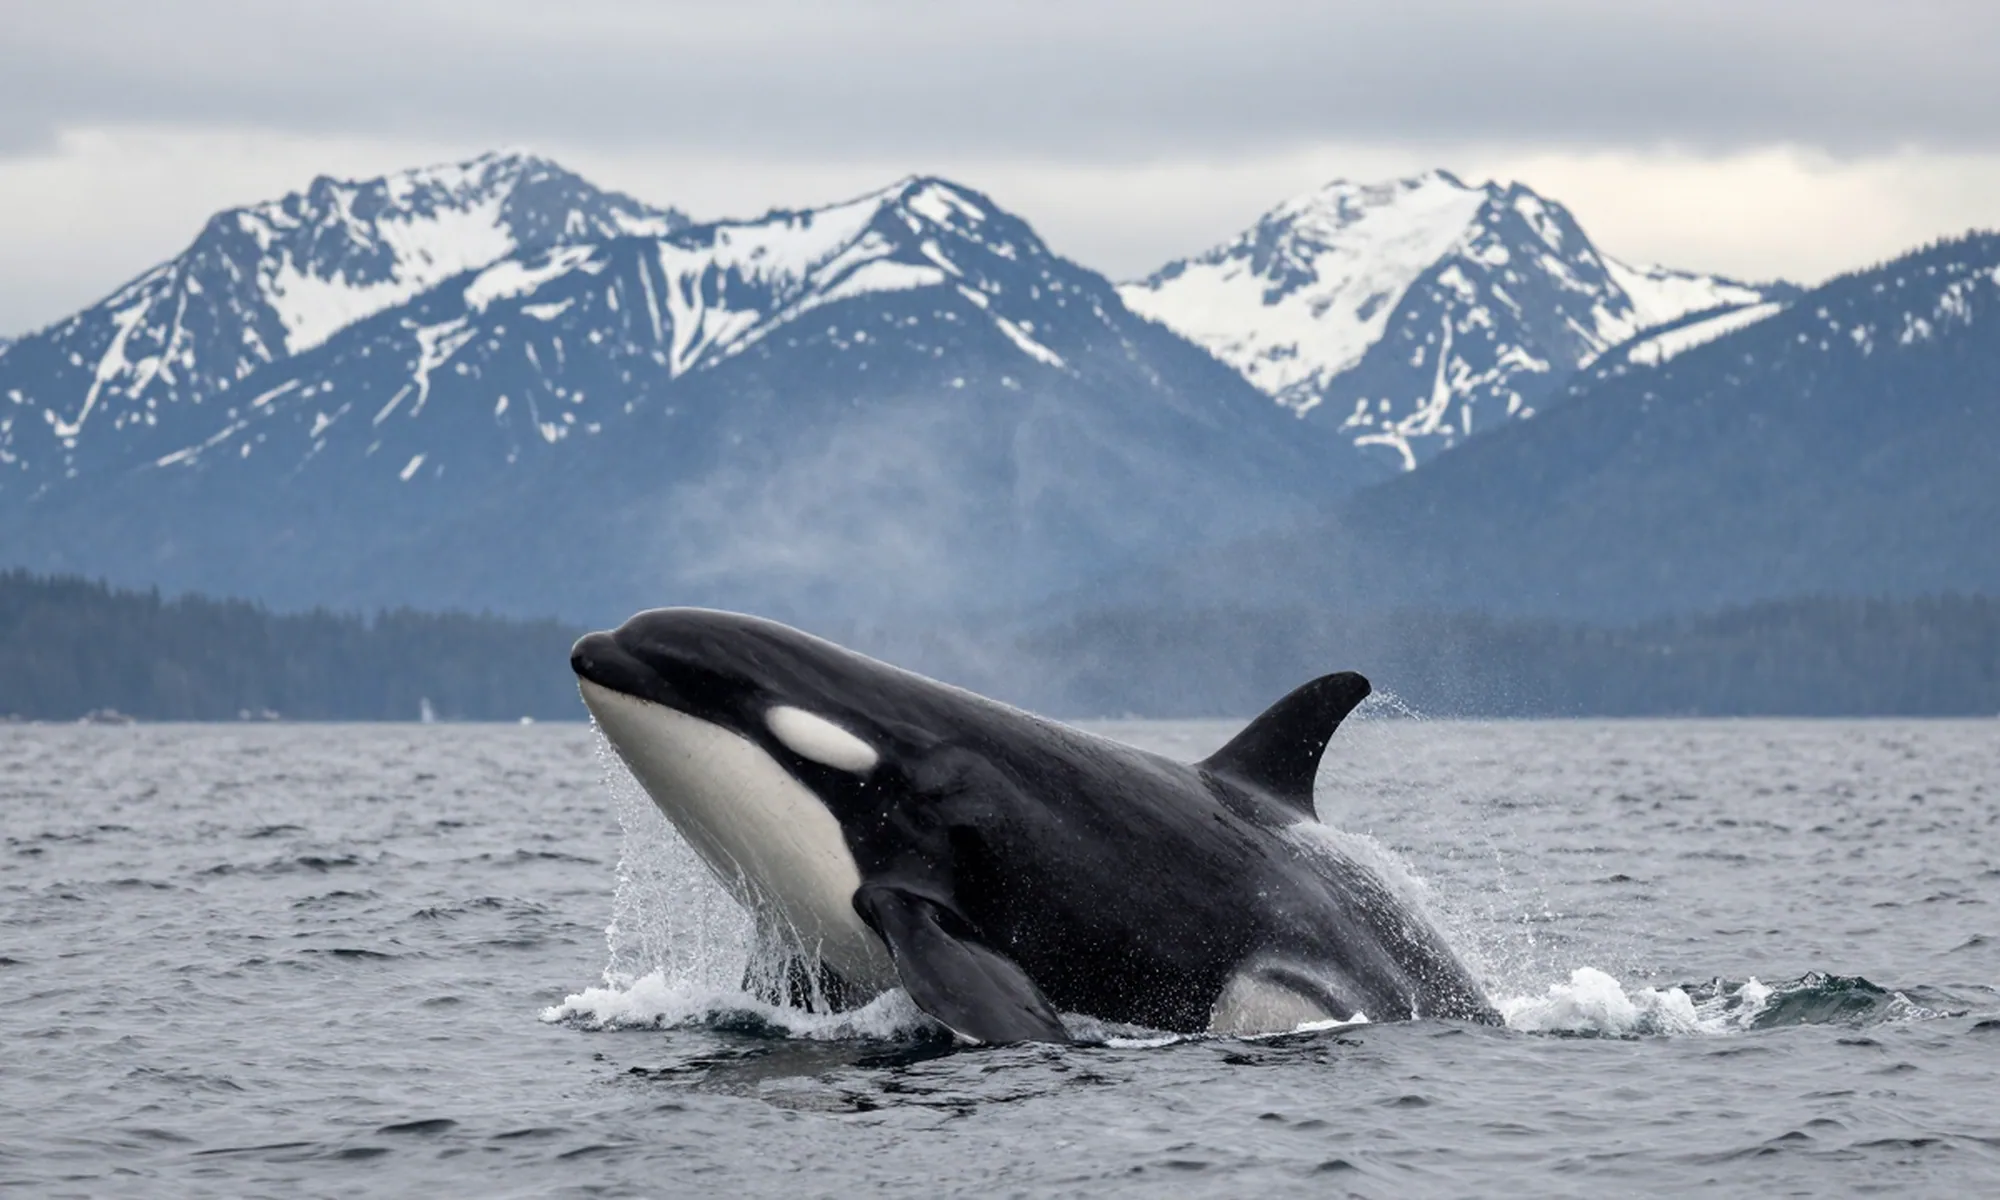
Southern Resident census · record 2026-09-07
74Southern Resident orcas alive at the last complete census▼ 1 on the previous census (down one animal)Census date 1 July 2026 · next count 1 July 2027
Source. Photographic census by US Orca and partner survey teams, reconciled against the regional catalogue maintained continuously since 1976. Each animal is identified individually; nothing on this line is modelled.
Standing
Record 2026-09-07Seventy-four whales. One narrow window.
US Orca is a research and advocacy nonprofit working on the three things that decide whether Pacific orcas survive: enough salmon, quiet enough water, and clean enough blubber.
- Individuals
- 74
- Pods catalogued
- 3
- Years of photo-ID
- 50+
- Diet that is Chinook
- 80%
- Field days 2026
- 68
Figure 1 — Population, 1976–2026
Photographic count| Census year | Individuals counted · share of 1995 peak |
|---|---|
| 1976 | |
| 1980 | |
| 1985 | |
| 1990 | |
| 1995 | |
| 2000 | |
| 2005 | |
| 2010 | |
| 2015 | |
| 2020 | |
| 2023 | |
| 2026 |
Census years shown at five-year intervals to 2015 and annually thereafter. Counts are photographic, not modelled.
Table 1 — Census by pod
1 July 2026| Pod | Matrilines | Individuals | Adult females | Calves since 2021 | Change since 2016 |
|---|---|---|---|---|---|
| J pod | 7 | 25 | 8 | 5 | +1 |
| K pod | 4 | 16 | 5 | 1 | −2 |
| L pod | 11 | 33 | 11 | 4 | −3 |
| All pods | 22 | 74 | 24 | 10 | −4 |
Figure 2 — Diet composition
2019–2026 sampling- Chinook salmon 80%
- Chum salmon 9%
- Coho salmon 5%
- Steelhead 3%
- Other / unidentified 3%
| Prey species | Share of diet |
|---|---|
| Chinook salmon | 80% |
| Chum salmon | 9% |
| Coho salmon | 5% |
| Steelhead | 3% |
| Other / unidentified | 3% |
Figure 3 — Threat severity
Assessed 2026-09-07Prey Decline
Severity 5 / 5 · Critical · Worsening
What would move thisChinook escapement above the ten-year mean for three consecutive returns.
Vessel Noise
Severity 3 / 5 · Moderate · Improving
What would move thisA mandatory seasonal slowdown in the Haro Strait corridor, not a voluntary one.
Contaminants
Severity 4 / 5 · High · Flat
What would move thisStormwater treatment retrofits on the twelve largest urban outfalls.
Entanglement & Ship Strikes
Severity 2 / 5 · Low · Flat
What would move thisDerelict gear recovery funded every season instead of every third season.
| Pressure | Severity | Band | Trend | Lag to effect |
|---|---|---|---|---|
| Prey Decline | 5 | Critical | Worsening | 5–20 yr |
| Vessel Noise | 3 | Moderate | Improving | Immediate |
| Contaminants | 4 | High | Flat | 20–50 yr |
| Entanglement & Ship Strikes | 2 | Low | Flat | 1–3 yr |
Reading the record
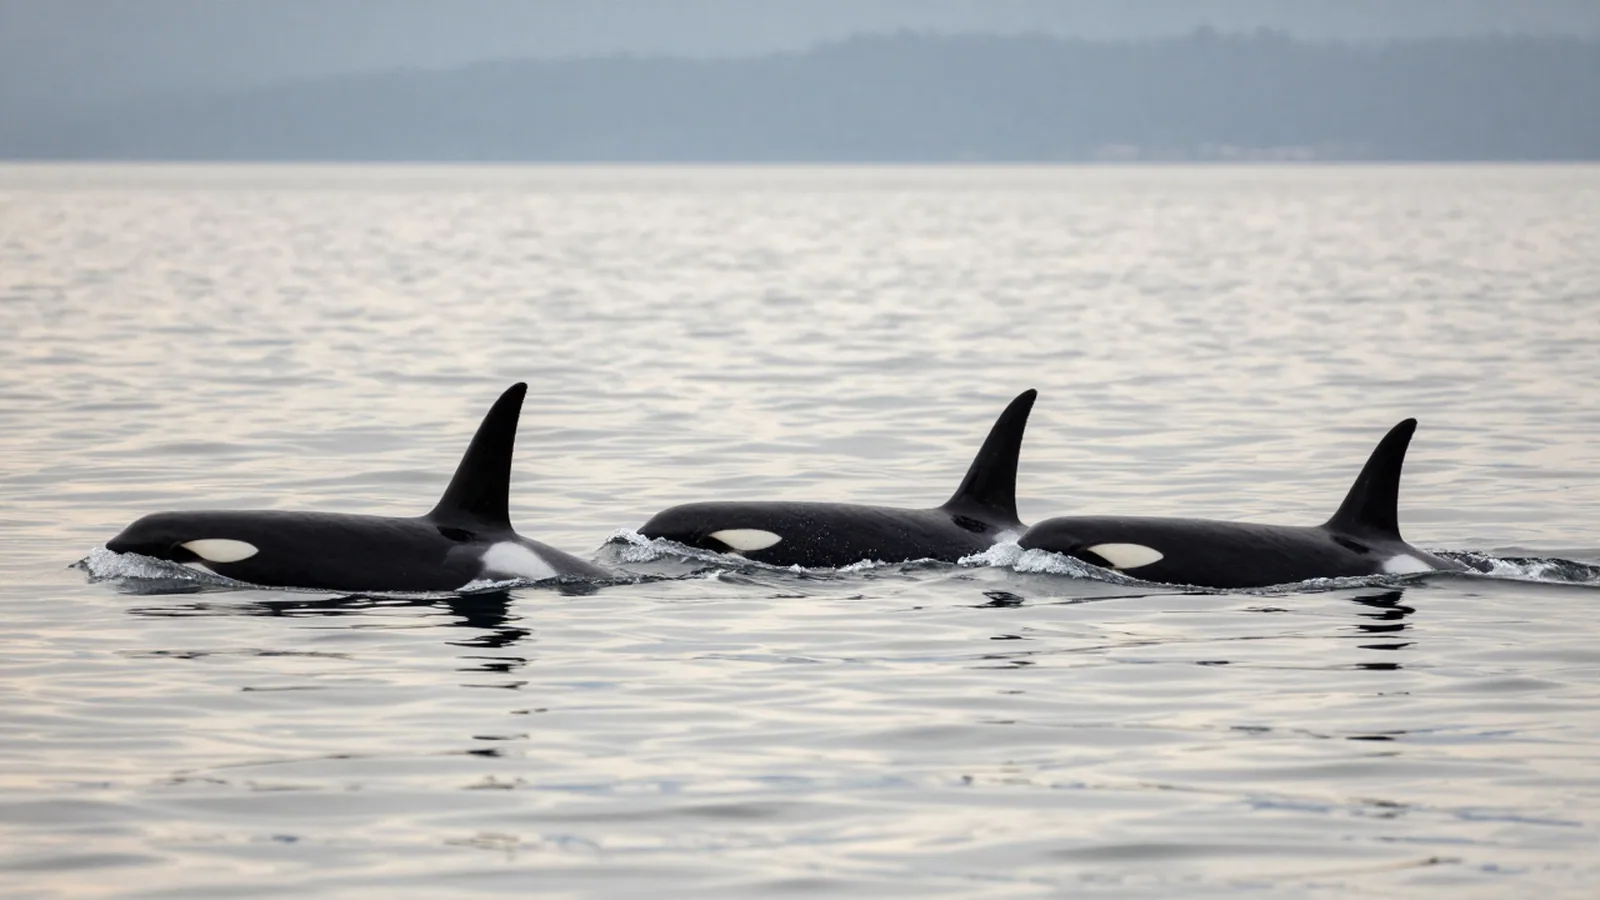
Every Southern Resident orca alive today has been photographed, catalogued and given a name. Researchers can identify each one on sight. That level of knowledge is extraordinary, and it exists because the population is small enough that it is possible — which is the problem.
A group this size has no statistical buffer. There is no margin in which a bad year averages out.
Cause of decline
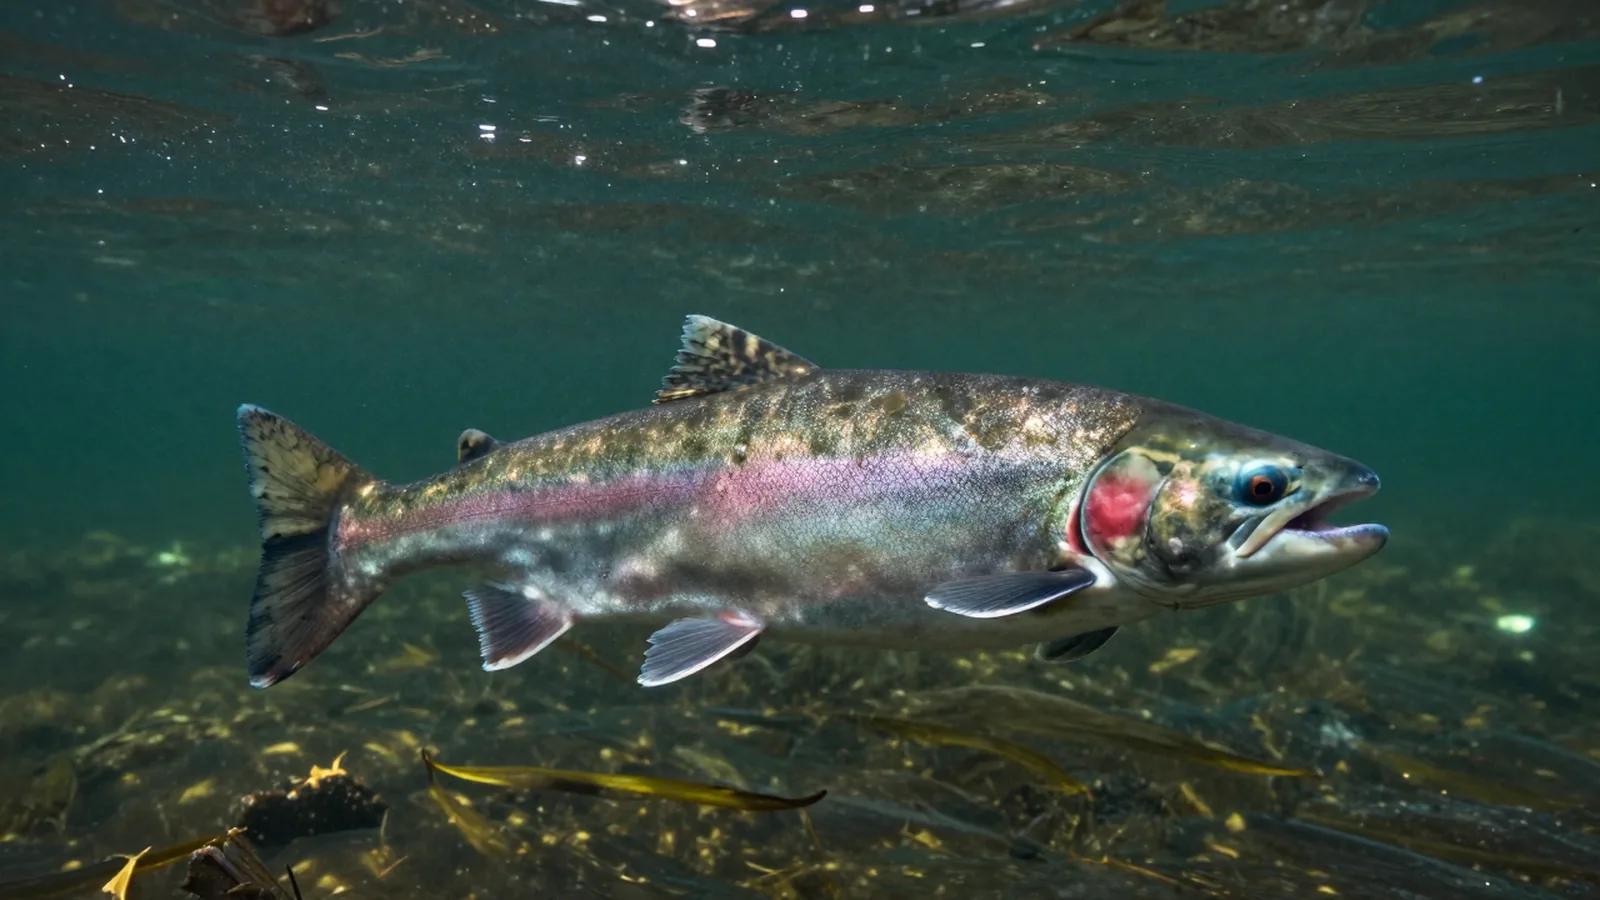
The threats are documented, mechanistically understood, and mostly solvable. Chinook salmon runs have collapsed. Vessel noise masks the echolocation the whales hunt with. Banned contaminants still cycle through the food web and pass from mother to first calf.
None of this requires new science to act on. It requires deciding to act.
They are not being hunted. They are being starved.
Populations on this coastline
4 recordsSame coastline, three populations that do not interbreed, do not share language, and do not share a fate.
| Population | Individuals | Trend | Listing | Primary prey | Typical group |
|---|---|---|---|---|---|
| Southern Residents | 74 | ▼ −4 | Endangered | Chinook salmon | 3 pods |
| Bigg's orcas | ~380 | ▲ +62 | Not listed | Marine mammals | 2–6 |
| Offshore orcas | ~300 est. | — unknown | Data deficient | Sharks (inferred) | 30–100 |
A fourth record covers behaviour and culture across all three: Behavior & Culture.
Programme
3 records| Programme | Scope | Headline figure |
|---|---|---|
| Field Research | Photo identification, acoustic monitoring and non-invasive sampling across a short field season. | 4,210 photo-ids logged |
| Policy & Advocacy | Turning field data into rules that actually change what happens on the water. | 6 hearings attended |
| Education & Outreach | Coastal communities decide what happens on this water. They should have the data. | 62 skipper briefings |
Latest field notes
JournalListening Through a Noisy Ocean
What eight months of hydrophone data says about when the Salish Sea actually goes quiet.
What Photo-ID Actually Tells Us
Fifty years of dorsal fin photographs, and why the catalogue is the single most valuable thing we have.
The Salmon Problem Is a River Problem
You cannot fix orca nutrition in the ocean. The work is four hundred miles inland.
Orcas can't wait for consensus.
Field seasons are short and the population is small. Steady support is what keeps boats on the water and hydrophones in the sea.